Twitter’s Impact on Elections
The rise of social media has dominated every aspect of our daily lives. In the height of the 2020 presidential election and as COVID-19 rampaged throughout the world, it facilitated increased online discussion, as well as the spread of information and misinformation. This article investigates the relationship that discussion on social media has with election outcomes. It finds that in comparing two distinct presidential elections, both of which took place as Twitter usage grew steadily, increased discussion levels were present during a Democratic win of the election.
Inspiration
This study was motivated by recent studies investigating how Twitter might affect election outcomes. In both 2016 and 2020, Twitter was used heavily as a means of communication between representatives and constituents as well as amongst constituents themselves. Some studies have shown that social media activity such as discussion on Twitter lowered the republican vote share in 2016 by 0.2%. In close elctions, this has a significant impact. If Twitter does have an impact on voting and election outcomes, the question then becomes which way does it tend to favor. The same study suggested that it would favor the Democrats as discussion online is typically done by young, more educated, urban indivdiuals who generally vote blue. As such, in order to investigate whether this is true, we decided to track daily discussion levels in both the 2016 and 2020 elections, both of which were highly controversial, in order to detect if there was a significant difference between the discussion levels. If present, it would indicate the possibilty of discussion on social media favoring one party over another.
Initial Analysis
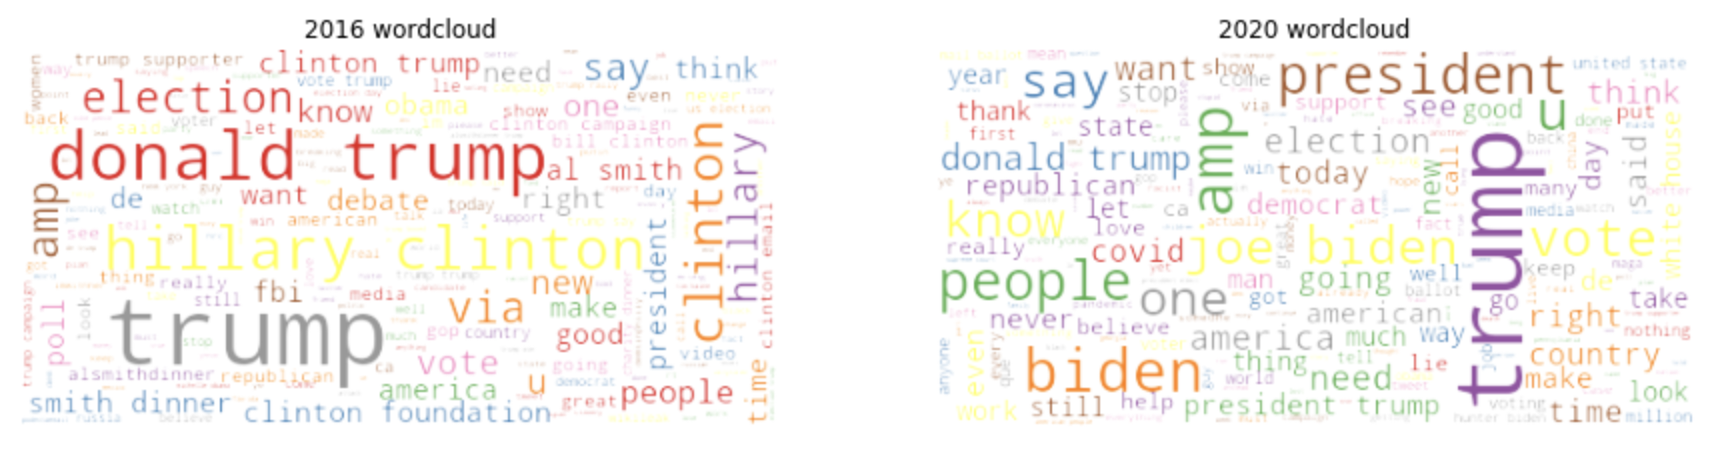
As we were dealing with textual data, our initial path leaned towards sentiment analysis and word frequency. As one may have guessed, Donald Trump was one of the main talking points in both of the elections. Mentions of the other candidate were still prevalent, but definitely not as much as Donald Trump was.
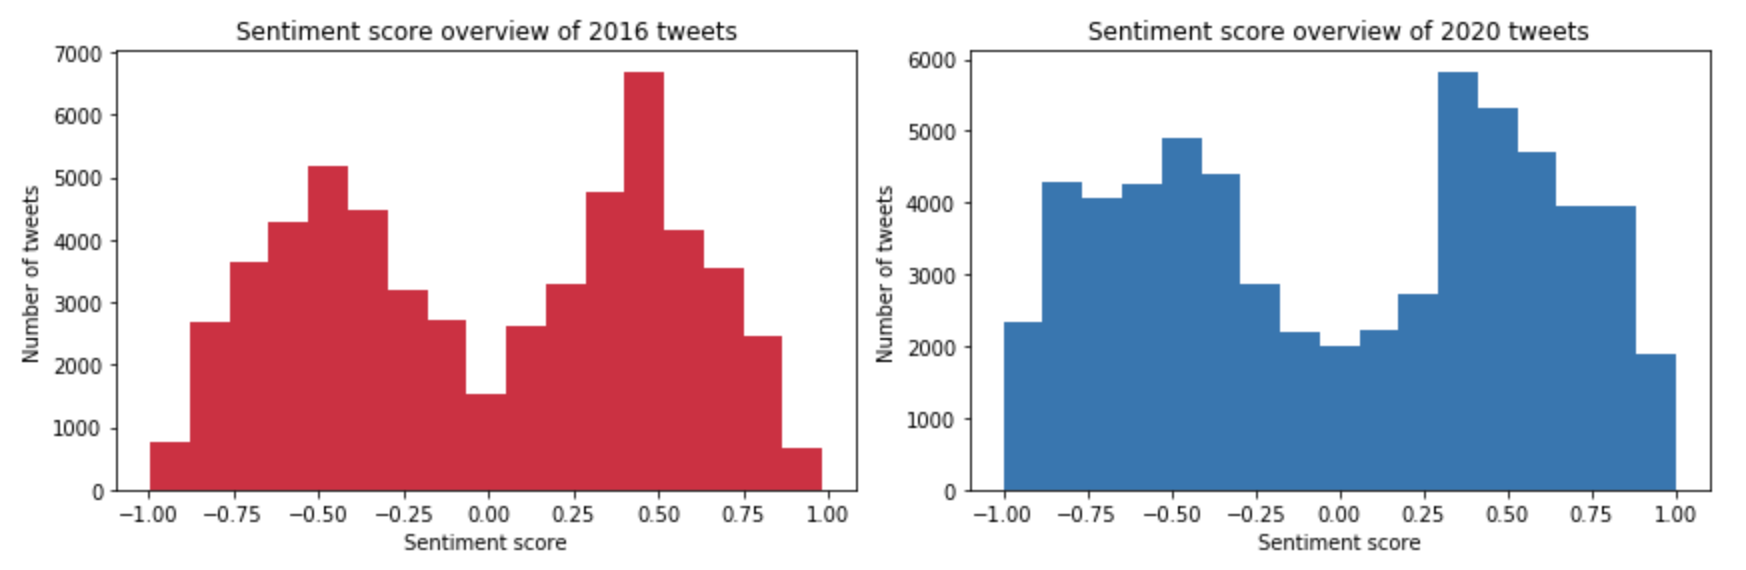
In investigating sentiment, we found that it was not indicative of anything really. In visualizing the distribution of sentiment scores for both of the elections, we found that both were bimodally distributed. This makes sense in hindsight as there are typically positive sentiment phrases, and negative sentiment phrases. However, the frequencies of these sentiments were not different between the two elections.
After completing the initial EDA, we looked into a time-series sentiment analysis for each of the election periods. During the time-frame of July 13 to November 10 of each year, we plotted the average daily sentiment on a scale of -1 to 1.
We defined a positive threshold at 0.05 (red) and a negative threshold at -0.05 (green). This way, we can capture the sentiment trends as well as peaks and troughs directly. In 2016 (top), the daily sentiment fluctuates severely through July and August as discussions heated up while the magnitude is much smaller in 2020 (bottom). As we approach the election day, the daily sentiment in 2016 dips twice, each corresponding to one of the presidential debates that occurred in early to mid-October. In the sentiment trend for 2020, a slight dip occurred towards the end of September, also matching the date of the first presidential debate.
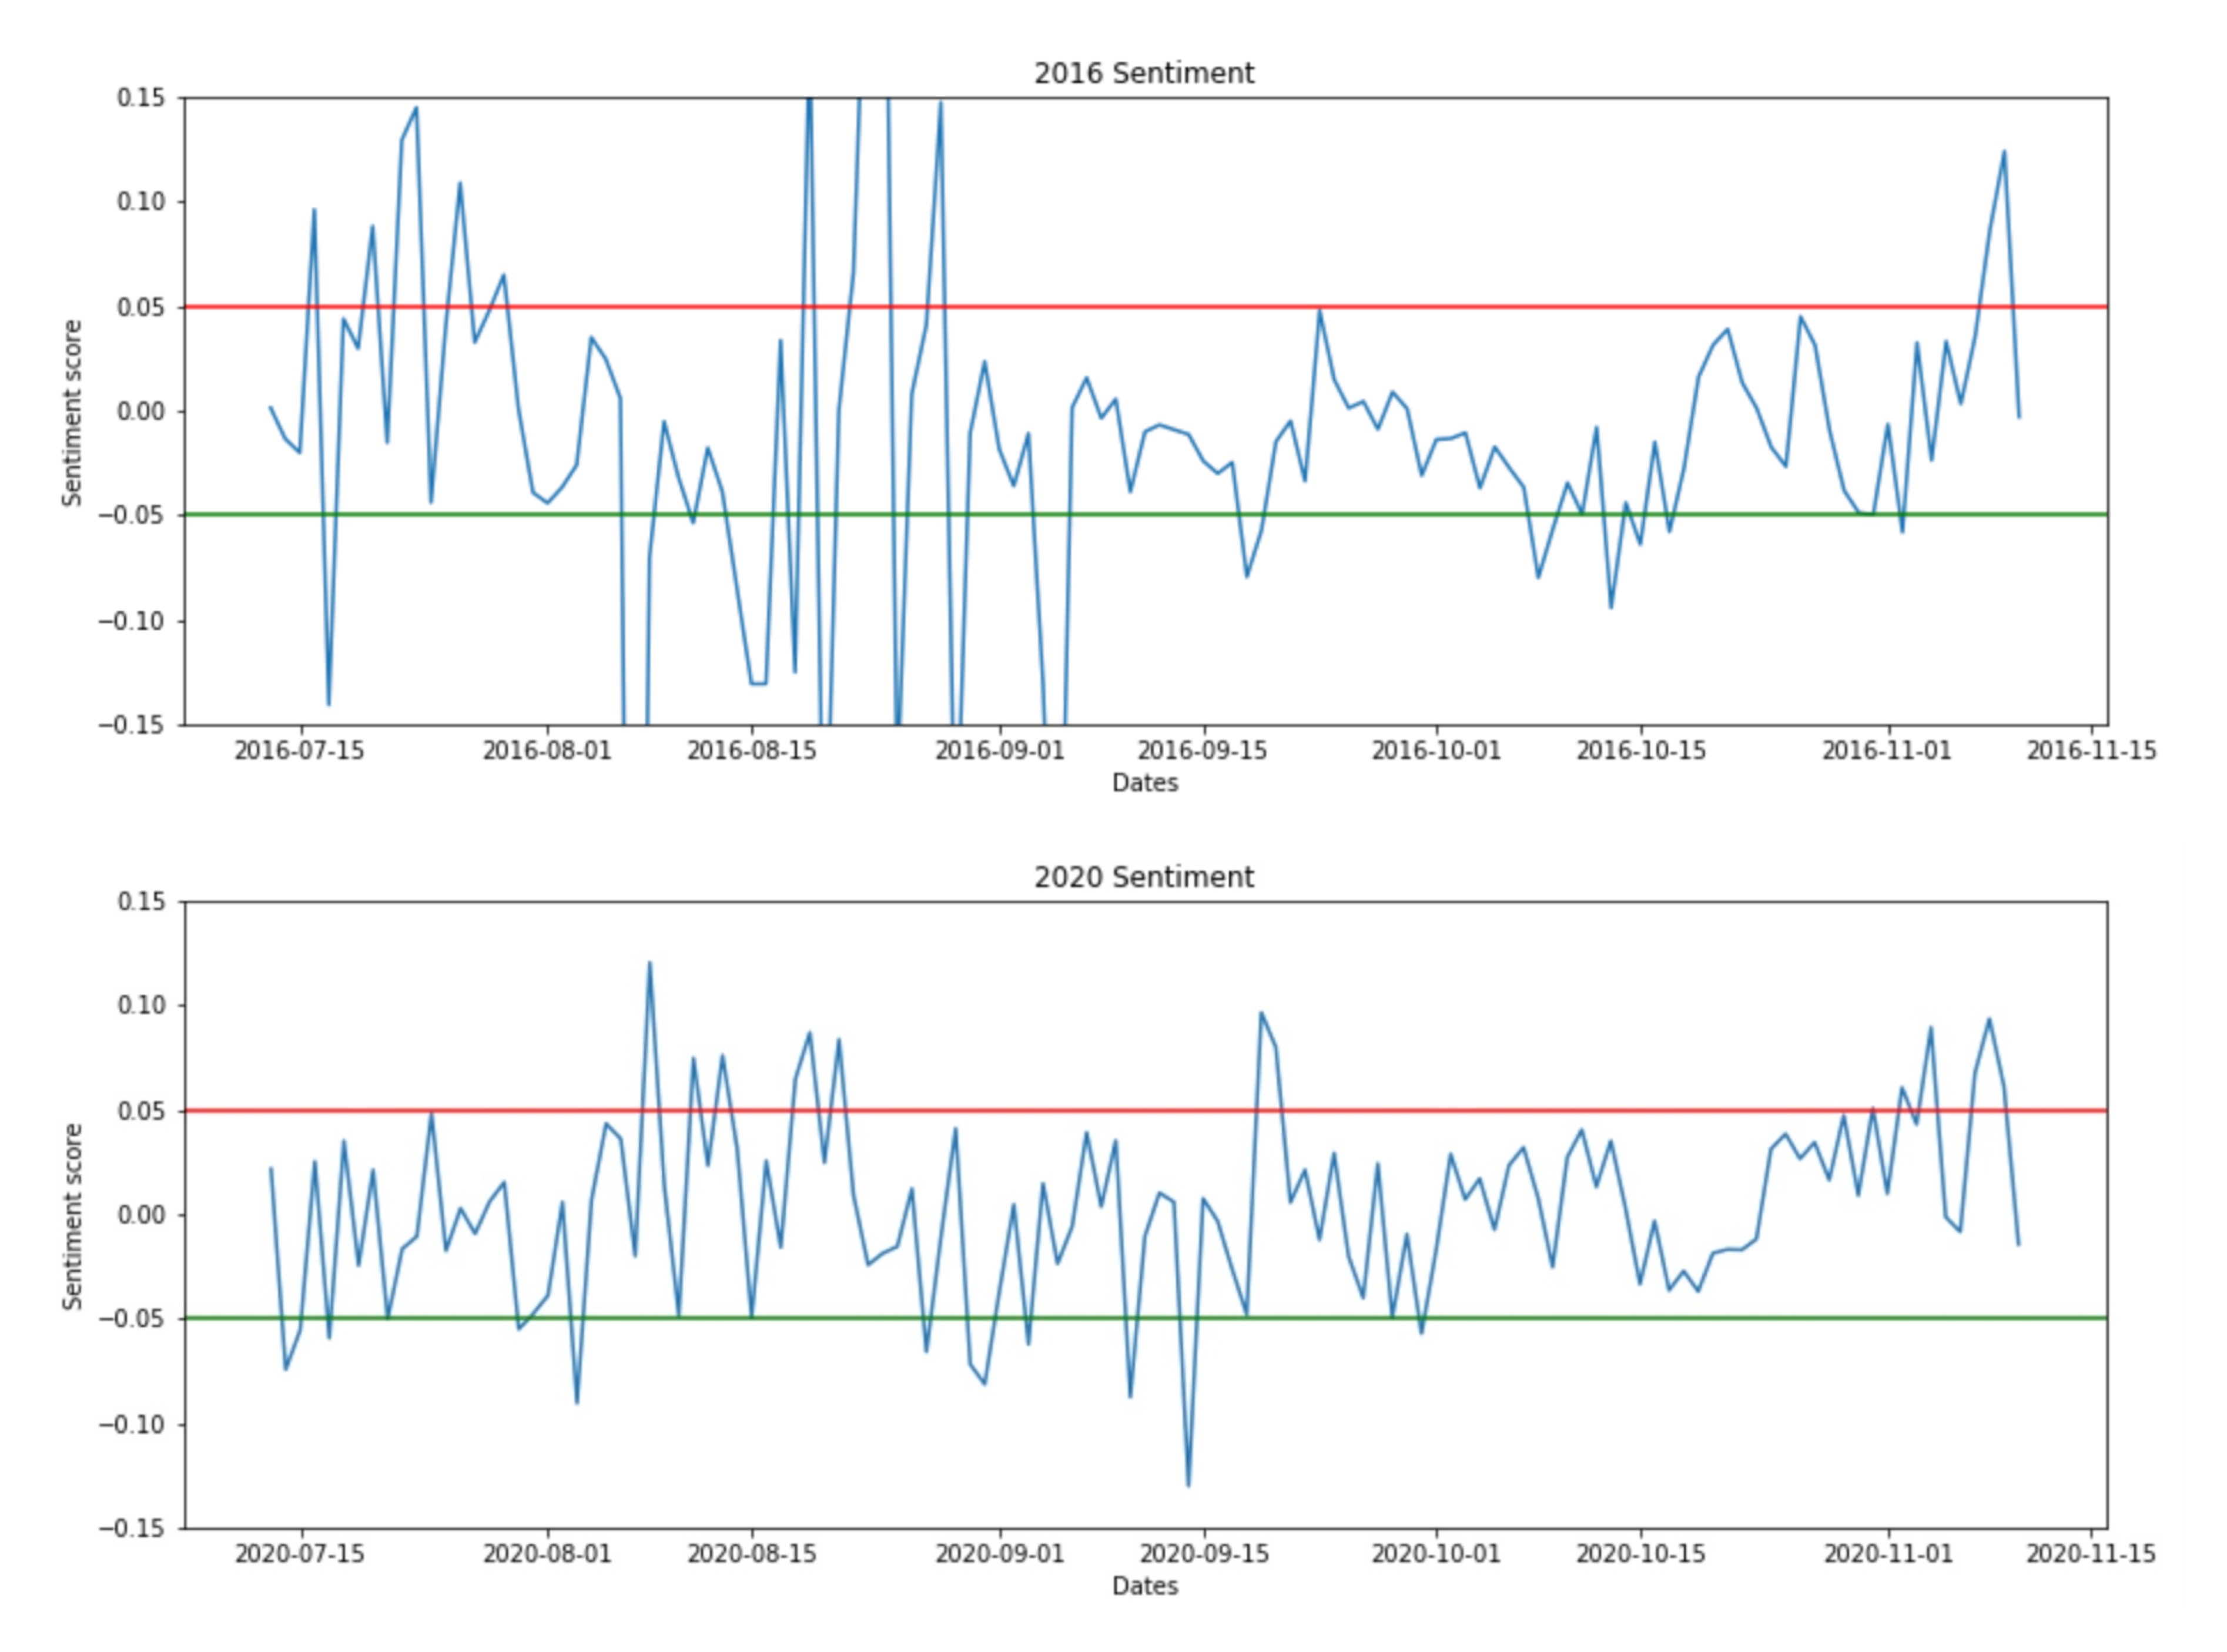
As we approach November, the 2020 trend peaked twice, once on election day and again on the day the day President Biden was elected. This differed from the 2016 trend as the single peak occurred only after when the election results were finalized. Hence, the sentiment peaks and troughs throughout the election period has been interconnecting with key election events and the discussion levels are likely to be more concentrated during these dates.
Discussion Metric
In order to track activity, we constructed a measure of activity referred to as the level of discussion:
For each unique day in the datasets, 2016 and 2020, we aggregated the total number of likes and retweets for each day. This was then transformed using the natural logarithm in order to eliminate skewness and preserve information. Only retweets and likes were taken into account in this analysis as comments proved substantially harder to retreive for each tweet due to the way Twitter stores its information.
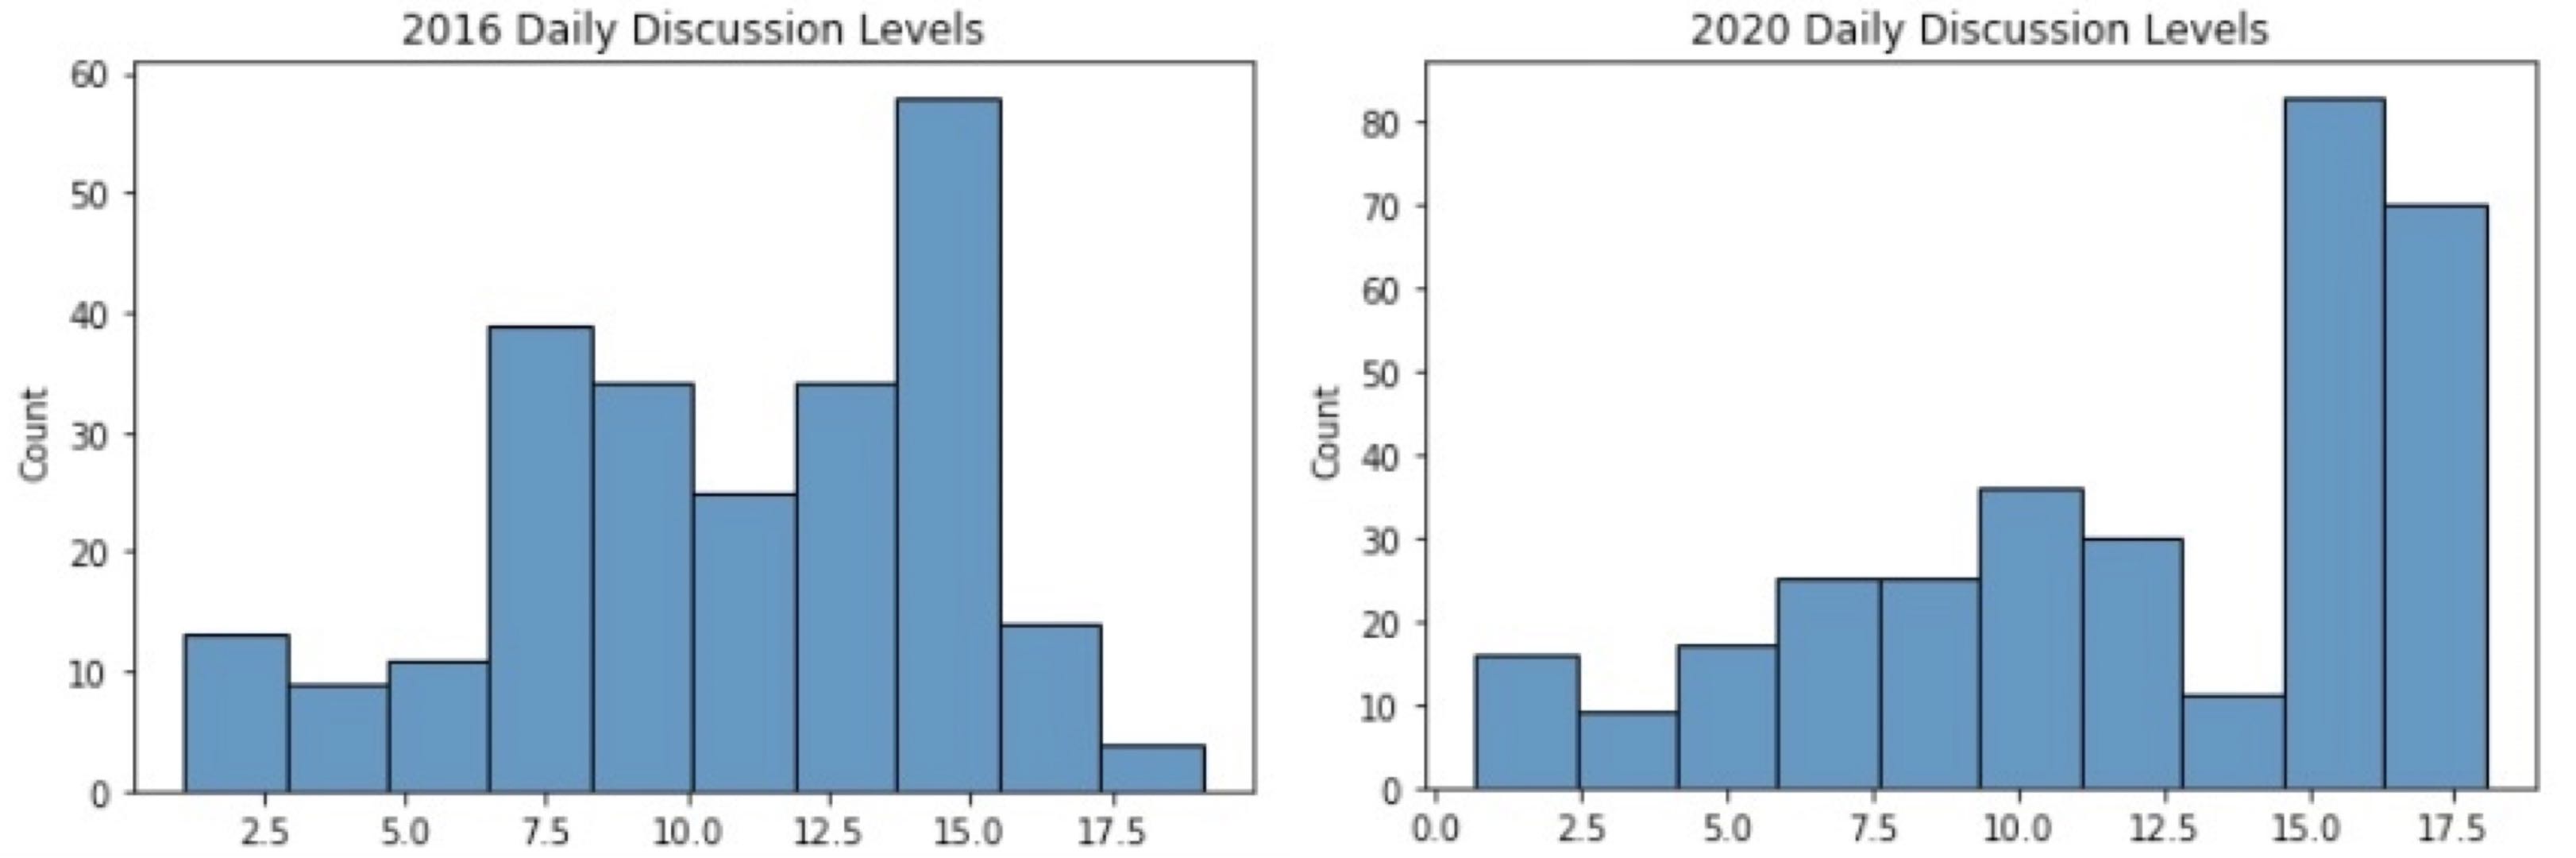
Distribution of Discussion levels
What we see here, is a difference in the distribution of daily discussion levels. The 2016 election’s discussion levels by day seem more more normally distributed in comparison the 2020 election’s discussion levels - at least visually. This was our first indication that the study which inspired this investigation may have had concrete results.
Significance of Difference
In order to evaluate whether the two distributions were truly different, we conducted a Difference of Means Z test. In doing so we used the following formula:
This resulted in a Z score of 3.9985 and a p-value of 0.0001346. This passes all signifcance tests at 0.1, 0.05, and 0.01 indicating that the difference in means that we found in our two samples of the 2016 and 2020 election tweets were very statistically significant.
Summary
Through this investigation we have seen that the sentiment, which we initally thought would also be related to the election outcome, was fairly the same in both elections. This is because sentiment is typically either positive or negative, and both are typically presented as reactions o specific phenomena. However, we did see a difference in discussion levels, which is what we set out to track. This difference in discussion levels between the two election outcomes was incredibly statistically significant. It confirmed out prior belief that there may be a relationship between the amount of discussion on social media platforms such as Twitter and the outcome of elections. This also confirmed the study from Princeton University that indicated that chatter on Twitter lowered the Republican vote share. In the end, no causality can be established, but this insight warrants further investigation.